Welcome the second in a series of tutorials on how to use a vector drawing program to do maps. The program we are using is Inkscape which is freely available.
First bring up the map you created from the first part of this tutorial or download Sample Map 1
Remember to right click and use Save Link As.. This is an SVG files which most browsers can display.
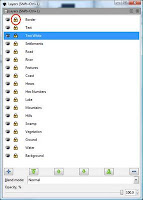
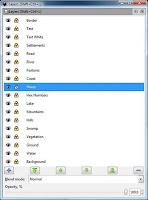
Once you have opened the file with Inkscape then click on the menu Layers->Layers... The following dialog will appear.
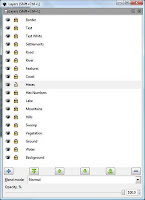
Make sure that Hexes is unlocked AND highlighted in blue.
Now click on the menu File->Document Properties
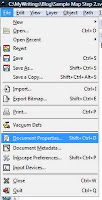
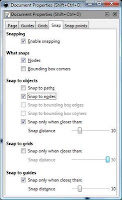
A dialog will appear.
Click on the Snap tab and make sure it looks like below. You will likely need to click on Snap to Nodes (it is in the middle of the dialog).
Then click the red X in the upper right corner.
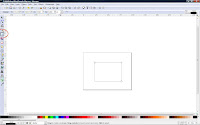
Then click on the Stars and Polygon tool on the left side of the screen.
In the upper left corner, click on the star and then the polygon. There is some odd issues with Inkscape that causes you to draw a star despite having the polygon selected. This will fix that issue.
Then make sure you change the corners to 6.
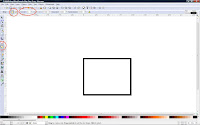
Now draw a single hex.
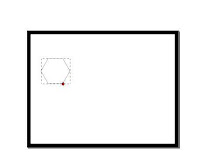
I can't really show this so you will have bear with me.
1) Click and HOLD DOWN the left mouse button anywhere where it is white.
2) With the opposite hand hold down the control key.
3) Drag the mouse you will see the hex increasing in size and rotating.
4) Because you are holding down the control key it will only rotate in 15 degree increments.
Rotate it so the top and bottom are flat. The size is not an issue just stop when you have the top and bottom flat.
5) Release the left mouse button .
You have your first hex.
Now you will have to decide how many hexes you want from top to bottom. For this tutorial I am picking ten hexes. The actual number will depend on your scale and the region you are making up.
Now select the hex by clicking on it.
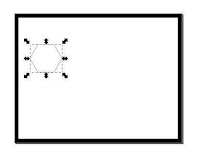
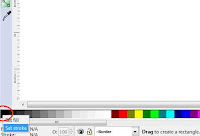
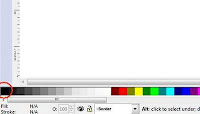
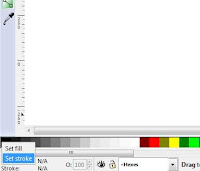
Go down to the lower left corner and right click the black color. Click Set Stroke. This will make the border of the hex black. Later one we may want to change it to a shade of gray to lower the contrast with the coastline and other features of the map.
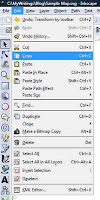
Then click on the menu Edit->Copy
Then click on the menu Edit->Paste
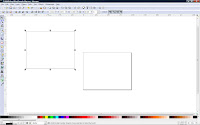
You will see a second hex appear.
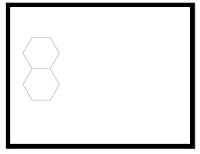
Drag it underneath the first hex. Drag it so that one of the upper corner is near one of the first hex's lower corners. At some point when they are close enough you will see the second hex snap into place along the bottom.
Release the mouse button.
Congratulations you have your second hex nicely aligned with the first one.
Do this until you have a column of ten hexes.
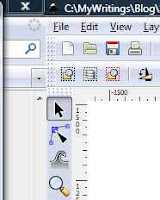
Make sure you have the arrow tool (the topmost tool) selected.
Draw a selection box around the column. Then click the menu Object->Group. This will unite all ten hexes into a single group.
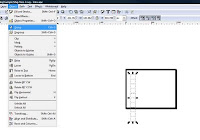
Then click the menu Edit->Copy
Then click Edit->Paste.
Drag the column so that it dovetails with the first column. The even columns will be a half hex lower and the odd Columns the same height as the first column. You want about 15 columns like below.
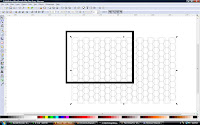
Using the Arrow Tool select all the hexes.
Click on Object->Group. This will unite all the columns until one large hex grid.
Now drag the grid so that the upper left corner is near the inside upper left corner of the border.
Zoom in using the View Menu or by holding down the Control Key and moving your mouse wheel.
When you are zoomed in. Drag the hex grid so that the top edge and the left corner of the upper left hex touches the border perfectly. This is shown below.
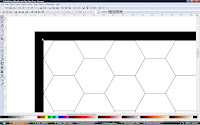
Then zoom out until you can see everything.
You will notice that your hexgrid has eight selection handles. Grab the lower right one with your mouse. Hold down the control key and drag the corner. You want to fit rows as close as you can to the top and bottom inside edges of the border. As well as having the right corner of a column of hexes touching the inside right edge of the border. If you have done it correctly the result will be as below.
The control key keeps the proportions of the resizing objects even so your hexes don't get distorted.
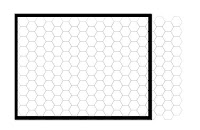
It is ok if the top and bottom edges of the hex columns don't quite touch. We will fix that in a later step. But you will see that we have a lot of extra columns and a few extra on the bottom.
You want to click the menu Object->Ungroup about three or four times so that we are ungroup down to the individual hexes.
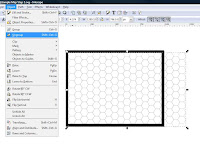
Start selecting any hexes that lay outside of the border and delete them.
The result should be this. Save your map and we are done with tutorial #2.
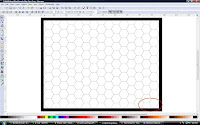
It is not easy to get the right proportions for a hex grid so always include extra columns and rows to have maximum flexibility.
Invariably you will have small gaps between the edges of the hex grid and the border. We can fix this and will do so in the next tutorial. After we are getting into the actual drawing of the map.
The final result can be downloaded from here.
Part 3
▼
Friday, October 31, 2008
Wednesday, October 29, 2008
Mapping Tutorial #1 (Setting up your drawing)
Welcome to Part 1 of a series of Mapping Tutorials.
We are going to be using a piece of software called Inkscape.
Inkscape is a open source Vector Drawing Package available for free at http://www.inkscape.org
It has a lot of nice features comparable to other vector drawing software like Adobe Illustrator and Corel. While the commercial packages have many more nifty features Inkscape has everything we need for mapping and it is free!
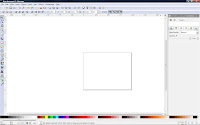
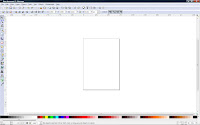
Download the latest version and install it. When you run the software you will see the following screen.
First you do is click on the menu File then Save. Give it a name like Document Template or Sample Map.
Now we need to setup the basics.
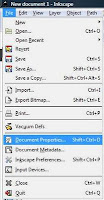
Click on the menu File->Document Properties
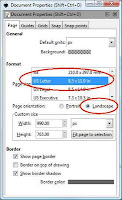
The following dialog will appear.
Change the page size to US Letter and the Page Orientation to Landscape. After you are done click the Red X in the upper right corner.
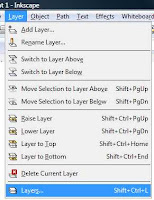
Next click on the menu Layer->Layer... (it's all the way at the bottom)
You will see a dialog appear on the right side of the screen. This is called a docker and it docks to one side or the other. Drag it out of there by dragging the title bar. Then goto the lower right corner and drag it until it fill 2/3 of your screen from top to bottom.
You will see this. Now use the blue + 'plus' button to add a layout, name it Background. This several more times adding the following layers
Water, Ground, Vegetation, Swamp, Hills, Mountains, Lake, Hex Numbers, Hexes, Coast, Features, River, Road, Settlements, Text White, Text, Border.
After you add the layers scroll through what you added and click the lock symbol. It is circled in red below. The lock symbol locks that layer so that you can't draw on it. This prevents drawing on the wrong layer.
In the cut and paste days with glue and paper layers are like films of acetate. You build up your map or presentation by starting with a bottom sheet of acetate layering each successive sheet on top until the drawing was finished.
Then click the Border layer and click the lock system to unlock it. Make sure it is highlighted in blue. Then click the Red X in the upper right corner.
In the lower left corner there are two fields call Fill and Stroke. Fill control what color is the inside of a shape, Stroke controls the color of the border. For now we want the stroke black and the fill set to n/a
First click the rectangle tool on the left side of the screen. Then go down to the lower left and right click fill. On the menu make sure you click Remove Fill at the bottom. Then move up to the the color strip and right click black. On the menu click set stroke.
Next use the rectangle tool and draw a rectangle anywhere on the page. You click and then drag to form the rectangle.
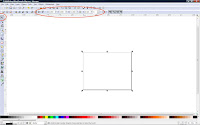
Next click the arrow tool at the top of the tool strip on the left side of the screen. Click on the rectangle. You see selection handle appear around the rectangle.
Finally look at the second toolbar down from the top.
You will see four fields in the middle of the toolbar. This will show the dimensions of the rectangle you just drew. Go to the last field which is a drop down list. Click the down arrow and pick in (inches).
Then for the other four fields make X 0 (zero). Y 0 ,W (width) 11, H (Height) 8.5
See below how this looks
Then click on the menu Edit->Copy. Note you not see any visible change here.
Make sure you are still on the Arrow tool on the left side of the screen. Click anywhere OUTSIDE of the rectangle. You will see the eight selection handle disappear.
Then click the Menu Edit->Paste
You will see something like below.
Next change the fields for this rectangle as follows
X .25, Y .25, W (width) 10.5, H (height) 8.0
Then move the cursor well outside of the two rectangles. Hold down the left mouse button while the cursor is up and to the left of the two rectangles and then DRAG the mouse. As you drag you will see a dashed box appear. This is a selection box. Drag it until it surrounds both rectangles and release the left mouse button.
The bottom bar will report that you will have two objects selected.
If this is the case then click the menu Path->Difference. You will not see any visible changes other than the message at the bottom will change to Path (8 nodes) in layer BORDER.
What this does make the smaller rectangle punch out a hole in the larger rectangle. This means any objects that are layered below the border will show through the punched out area.
Click on black in the color strip at the bottom of the screen.
You will see the following
Now click on the menu Layer->Layers...
The following appears.
First Lock Borders
Next click on Hexes and it will be highlighted in blue.
Unlock Hexes by clicking the lock/unlock symbol next to the name.
Now save the file.
You are ready for Part 2.
What we just did is draw a 1/4 inch border around our drawing. For most printers or projects there is some amount of spaces that you can't print on. Usually it is about 1/4. By defining this border you know where the bounds are. Also it gives teh resulting map a pleasant looking boundary. As you become more proficent you may want to experiment with fancier or thick borders.
You can download the finished drawing from here http://www.ibiblio.org/mscorbit/map/Sample Map Step.svg
Note that you will have to right click the link and on the menu click Save Target As. This is because many web browser can display the svg format that Inkscape uses.
Part II
Monday, October 27, 2008
Mapping with Hexes
Hex Paper - one of the signature items of the RPG hobby. Originating in the board and counter games of Avalon Hill, hexes formed the basis for mapping nearly all of the early settings. When miniatures returned to widespread use in RPGs hexes were scaled up to be used on battle mats.
Rob's Note: An updated version of this post is an appendix in How to Make a Fantasy Sandbox.
For mapping there is a big gotcha in using hexes. Unlike grids it is not as straight forward to use when you are drawing multiple maps to be joined or expanding the scale of a larger map. The advantage of using hexes was that it offered quick and easy management of sub maps and handling movement.
Note: You can click on the thumbnail to get a full image.
There are two types of hex grids
Horizontal
Vertical
Of the two vertical is by far the most popular used. The examples in this post will be using the vertical hex grid.
Hexgrids have several choices how they can be formed.
These are rectangular hex grids.
You can make the end columns even in number.
or
You can make the ends uneven in length.
The last arrangement is used when you sub dived a large hex into smaller hexes.
Joining Maps
If you are just mapping one region and that all then you don' t need to worry about how to join two hex maps together. However if it is going to take multiple maps to completely cover your campaign then this issue needs attention
Unlike rectangular maps hex maps will have some degree of overlapping. This is because for vertical hex grids the top and bottom are uneven. It is possible not to overlap however you have to alternate two different hex grids.
There are two other ways of handling the vertical joining of two hex grids.
A half overlap
A full overlap
Of the two I prefer the half overlap. It slightly spreads out the vertical coverage of each individual map and I only have to copy the top and bottom hex every other column.
The horizontal joining has several types.
If you use a hex grid with uneven numbers of hexes you can lay them side by side with no overlap.
Judges Guild in the Wilderlands of High Fantasy was one of the first publishers to deal with this issue. They used 18 hex maps arranged in a three maps across 6 maps vertically. Each Hex maps had 52 columns, and 34 rows on the odd columns (1,3,5, etc) and 33 rows on the even columns. The resulting hex grid had uneven ends on the left and right edges.
They decided to use the half overlap to join the maps on the top and bottom edge. However they messed up on the left and right edge and decided to make them overlap. Because of the even ends of the hex grid this resulted in a staircase effect as below. Each map to east was a half row south of the map to the west.
For hex grids that have even ends you can do a full overlap of the last hex column with the first hex column of the next map.
I prefer the full overlap option as it helps ensure that I am correctly drawing from one map to the next. The same reason applies to the half overlap option.
Numbering Hexes
For vertical hex grids the numbering system is XXYY where XX is the column number and YY is the row number. This is reversed for horizontal hex grids.
Sub-maps
Judges Guild is famed for having a complete mapping system that goes from campaign level of 5 miles per hex to a regional level of .2 miles per hex and finally to a local level of 42.24 feet per hex. Each larger hex was subdivided by smaller hexes 1/25 th the size of the larger hex. Hence the odd number at the local level.
If your scale per hex is an odd number (5 miles, 25 miles, etc) it is easy to draw up a subdivided hex as shown below. You pick a center hexes and count the remaining hexes outwards. You can use the six points to draw up the six sides of the larger hex.
Hexes with a even scale (10 miles, 30 miles, etc) are not as easy to subdivide. The lines you will be drawing for the sides will be meeting in the center of hexes.
There is alternative for drawing even scale hexes but you will lose the center hex. You will have decide which form is best to use for you game.